🔍Risk-Neutral Densities: Extracting and Interpreting Market-Implied Probability Distributions from Option Prices
A Quantitative Perspective on One of Finance's Most Powerful Tools
ALpresi RTX** delivers institutional-grade analytics with native, high-performance capability to calculate and visualize Risk-Neutral Densities (RND) directly from option chains. Quantitative traders and analysts can rapidly extract precise market-implied probability distributions, key quantiles, tail probabilities, and forward-looking insights -all within a unified, production-ready platform.
Introduction
Option prices aggregate the views, fears, and risk tolerances of market participants across a wide spectrum of possible future outcomes. One of the most insightful ways to decode this information is through the risk-neutral density (RND) -the probability density function of an underlying asset's price at a specific future expiration, implied directly from observed option prices under the risk-neutral pricing measure.
The RND is not the "real-world" or physical probability distribution that governs actual price dynamics. Instead, it is the distribution under the equivalent martingale measure Q , under which the discounted price of the underlying (adjusted for dividends or carry) is a martingale. This property makes the RND the cornerstone for arbitrage-free pricing of derivatives.
Theoretical Foundation: Breeden-Litzenberger and the Extraction of the RND
The rigorous link between European option prices and the risk-neutral density was established in the seminal work of Breeden and Litzenberger (1978). Consider a European call option with strike K and maturity T. Its price C(K,T) can be expressed as the discounted expected payoff under the risk-neutral measure:
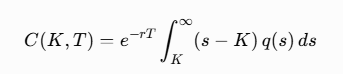
where q(⋅) denotes the risk-neutral density of the terminal asset price ST and r is the continuously compounded risk-free rate.
Applying Leibniz's rule for differentiating under the integral sign twice with respect to the strike K immediately yields:
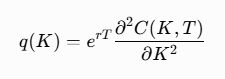
This elegant result shows that the curvature of the call price function with respect to strike is directly proportional to the risk-neutral probability density at that point. In practice, the first derivative also has a clear interpretation:
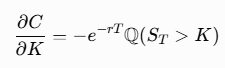
Thus, the entire cumulative distribution function (and hence any probability statement) can be recovered from the option surface.
Because market data consists of discrete, noisy bid-ask quotes, direct numerical differentiation is unstable. Modern implementations therefore fit smooth functions to implied volatilities (or directly to option prices) using splines, parametric families (such as mixtures of lognormals), or shape-constrained nonparametric estimators before performing the differentiation. Comprehensive surveys of these techniques appear in Jackwerth (1999) and practical "cookbook" implementations are provided by Malz (2014).
Visualizing and Interpreting the Risk-Neutral Density
The figure below displays a representative risk-neutral density estimated for an underlying asset price at expiration. Such plots are now routinely produced by quantitative desks and risk systems.
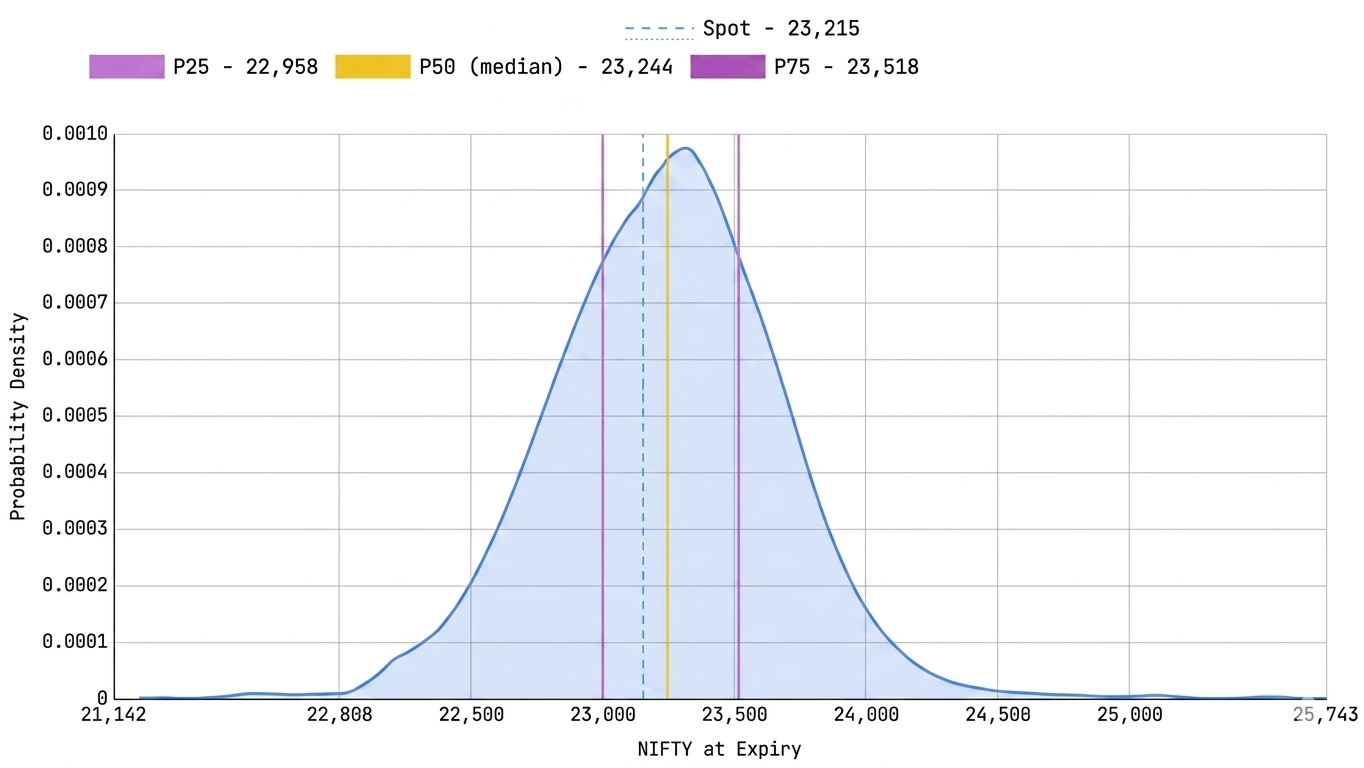
**Figure 1: Risk-neutral probability density of the underlying asset price at expiration using ALpresi RTX software. The dashed vertical line marks the current spot price of the asset. The solid vertical lines highlight three key quantiles of the risk-neutral distribution: the 25th percentile (P25), the median or 50th percentile (P50), and the 75th percentile (P75).
Quantitative Features Visible in the Plot
- Central Tendency: The median of the RND is the value m satisfying ∫ q(s)*ds=0.5 from infinity to m . In a risk-neutral world, the mean of the distribution equals the prevailing forward price F0(T)=S0*exp((r−q)T), where q denotes the continuous dividend yield (or equivalent carry adjustment). When the distribution exhibits limited skewness, the median and mean lie close to each other. The figure shows the median positioned slightly above the current spot, consistent with a modest positive drift under the risk-neutral measure for the horizon in question.
- Dispersion and Uncertainty: The width of the density encodes the market's aggregate view of volatility. The interquartile range (P75 − P25) provides a robust, non-parametric measure of the spread of the central 50 % of probability mass. Wider densities correspond to higher implied volatility; changes in width over time or across strikes reveal the term structure and skew of volatility.
- Asymmetry and Tail Behavior: Visual inspection of the density immediately reveals skewness and excess kurtosis. Equity markets frequently exhibit negatively skewed RNDs (fatter left tail), reflecting the higher prices commanded by out-of-the-money puts - a phenomenon sometimes termed "crashophobia." The plot in Figure 1 appears relatively symmetric with mild deviations, allowing a trader to quantify the precise degree of asymmetry by computing the third moment ∫(s−μ)^3 *q(s)* ds or by comparing left- and right-tail probabilities.
- Event Probabilities: Any interval probability is obtained by direct integration: Q(a<ST<b)=∫q(s)*ds ( integrate from a to b). This permits precise statements such as the market-implied probability that the asset will expire above a psychologically important level, or within a trading range. These probabilities are risk-neutral and therefore already incorporate the market's aggregate risk aversion; they are the correct probabilities to use for pricing, not for forecasting physical outcomes.
- Comparison with Spot: Marking the current spot price on the same axis as the future density highlights the expected evolution under Q. Large discrepancies between spot and the bulk of the RND can signal significant carry, expected dividends, or (when compared with econometric forecasts) differences between physical and risk-neutral expectations.
Why the Risk-Neutral Density Is Indispensable for Traders
For options market makers, volatility traders, structured-product desks, and quantitative hedge funds, the RND delivers actionable intelligence that raw implied volatilities or single-strike Greeks cannot provide.
1. Consistent, Arbitrage-Free Pricing of Complex Payoffs
Once the RND has been extracted from the vanilla surface, any European payoff f(ST)-barrier options, Asians, cliquets, structured notes, or custom exotics-can be priced by the simple quadrature:
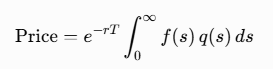
This guarantees internal consistency with the observed prices of liquid vanillas and eliminates model risk arising from inconsistent assumptions about dynamics.
2. Extraction of Market Sentiment and Risk Aversion
The RND conflates two distinct ingredients: the market's true (physical) beliefs about probabilities and the pricing kernel that encodes risk aversion and intertemporal substitution. By juxtaposing the RND against historical return distributions or forward-looking econometric models, sophisticated traders can back out implied risk premia or detect when protection against tail events appears unusually expensive or cheap. Figlewski's review emphasizes this distinction between the Q-measure (observable from options) and the P-measure.
3. Tail-Risk Monitoring and Portfolio Construction
Integrating the far left tail of the RND supplies risk-neutral probabilities of extreme downside scenarios. While these are not physical Value-at-Risk figures, they constitute market-implied stress tests that are fully consistent with the prices at which protection can actually be purchased. Many risk systems now monitor shifts in left-tail mass as an early-warning indicator of rising crash fears or liquidity premia.
4. Relative-Value and Distributional Trading Strategies
When a trader's proprietary forecast of the physical density p(s) differs materially from the prevailing RND in specific regions (e.g., higher probability mass in the right tail, or lower kurtosis), the discrepancy can be monetized through carefully constructed option portfolios. Classic examples include:
- Selling expensive OTM puts when the RND's left tail appears over-weighted relative to the trader's view.
- Trading the wings versus the body to express views on higher moments.
Calendar or event-driven strategies that anticipate compression or expansion of the RND around macroeconomic announcements.
Because the RND is recovered model-free (subject only to no-arbitrage smoothing), these trades are grounded directly in observable market prices rather than in a specific stochastic process.
5. Volatility Surface Analysis and Gamma Management
The shape of the RND is mathematically equivalent to the shape of the implied volatility smile (via the Breeden-Litzenberger mapping). Traders who understand this equivalence can better anticipate how gamma P&L will accrue as spot traverses regions of high versus low probability density. A steepening left tail in the RND, for instance, signals that downside gamma is becoming more valuable-information directly relevant to dynamic hedging programs and gamma-scalping strategies.
6. Model Validation and Stress Testing
Any candidate pricing model -local volatility, stochastic volatility with jumps, rough volatility, etc.-must be capable of reproducing the observed RND (or, equivalently, the entire implied volatility surface). Systematic comparison of model-generated versus market RNDs therefore serves as a powerful diagnostic tool for model risk.
Practical Estimation: From Theory to Production
Real-world implementation requires attention to several practical issues highlighted across the literature:
- Strike Coverage and Liquidity: Deep OTM options are essential for accurate tail estimation but suffer from wide spreads and stale quotes. Robust methods therefore impose no-arbitrage constraints and extrapolate carefully.
- Smoothing and Regularization: Malz (2014) demonstrates a particularly stable approach that works directly with the implied volatility smile, converts to call prices, and applies controlled differentiation.
- Multi-Maturity Consistency: When RNDs are estimated across several expiries, calendar arbitrage constraints must be respected.
- High-Frequency and intraday Updates: With modern data feeds, desks now track intraday evolution of the RND to capture rapid shifts in sentiment.
Conclusion
The risk-neutral density transforms the option chain from a collection of individual prices into a complete, internally consistent probability distribution. For the quantitative trader it serves simultaneously as a pricing engine, a sentiment gauge, a tail-risk thermometer, and a model-validation benchmark. Whether the objective is to price a bespoke structured product, to size a gamma hedge, or to detect when the market's risk-adjusted outlook has diverged from one's own view, the RND provides the rigorous quantitative framework required.
ALpresi RTX** delivers institutional-grade analytics with native, high-performance capability to calculate and visualize Risk-Neutral Densities (RND) directly from option chains. Quantitative traders and analysts can rapidly extract precise market-implied probability distributions, key quantiles, tail probabilities, and forward-looking insights -all within a unified, production-ready platform.
As data quality and computational power continue to improve, real-time RND analytics are becoming table stakes for sophisticated options businesses. Those who master both the theoretical elegance of the Breeden-Litzenberger relation and the practical nuances of its implementation will be best positioned to extract alpha from the rich information embedded in option surfaces.
This article is intended for educational and professional development purposes. Implementation of RND estimation should always incorporate rigorous validation against no-arbitrage conditions and market-microstructure realities.
Key References in the Literature
The following works form the essential reading list for any practitioner seeking to master risk-neutral densities:
- Breeden, D. T., & Litzenberger, R. H. (1978). "Prices of state-contingent claims implicit in option prices." Journal of Business, 51(4), 621–651. The original derivation of the fundamental relationship between call-price curvature and the risk-neutral density.
- Jackwerth, J. C. (1999). "Option-implied risk-neutral distributions and implied binomial trees: A literature review." Journal of Derivatives, 7(2), 66–82. Authoritative survey of estimation methodologies, including parametric, nonparametric, and implied-tree approaches available at the time.
- Figlewski, S. "Risk Neutral Densities: A Review." NYU Stern working paper. In-depth treatment of empirical regularities, the distinction between physical and risk-neutral measures, the pricing-kernel puzzle, and connections to volatility indices such as the VIX.
- Malz, A. M. (2014). "A Simple and Reliable Way to Compute Option-Based Risk-Neutral Densities." Federal Reserve Bank of New York Staff Report No. 677. Highly practical guide aimed at implementers; emphasizes robustness, simplicity, and regulatory applications such as systemic-risk monitoring.
- Bahra, B. (1997). "Implied risk-neutral probability density functions from option prices." Bank of England Working Paper. Early but influential review that popularized mixture-lognormal techniques and applications to central-bank monitoring of market expectations.
Subsequent research has extended these foundations to high-frequency settings, machine-learning density estimators, cryptocurrency and volatility-index options, and the joint extraction of RNDs across multiple underlyings for correlation and contagion analysis.