🔥 Whispers in the Volatility Surface: Inside the 0-DTE Volatility Mechanics of 02nd June 2026 Nifty50 India Index
Nifty's session on 02 June 2026 (0-DTE expiry) delivered a masterclass in volatile price action. The index opened under pressure at 23,229, only to engineer a robust intraday reversal and settle at 23,483.55 (+0.43%). While the spot market's late-stage surge felt chaotic to short-term momentum traders, the underlying options architecture had already telegraphed this move. A deep dive into the previous day's volatility surface reveals exactly how this upside potential was structural, not accidental.
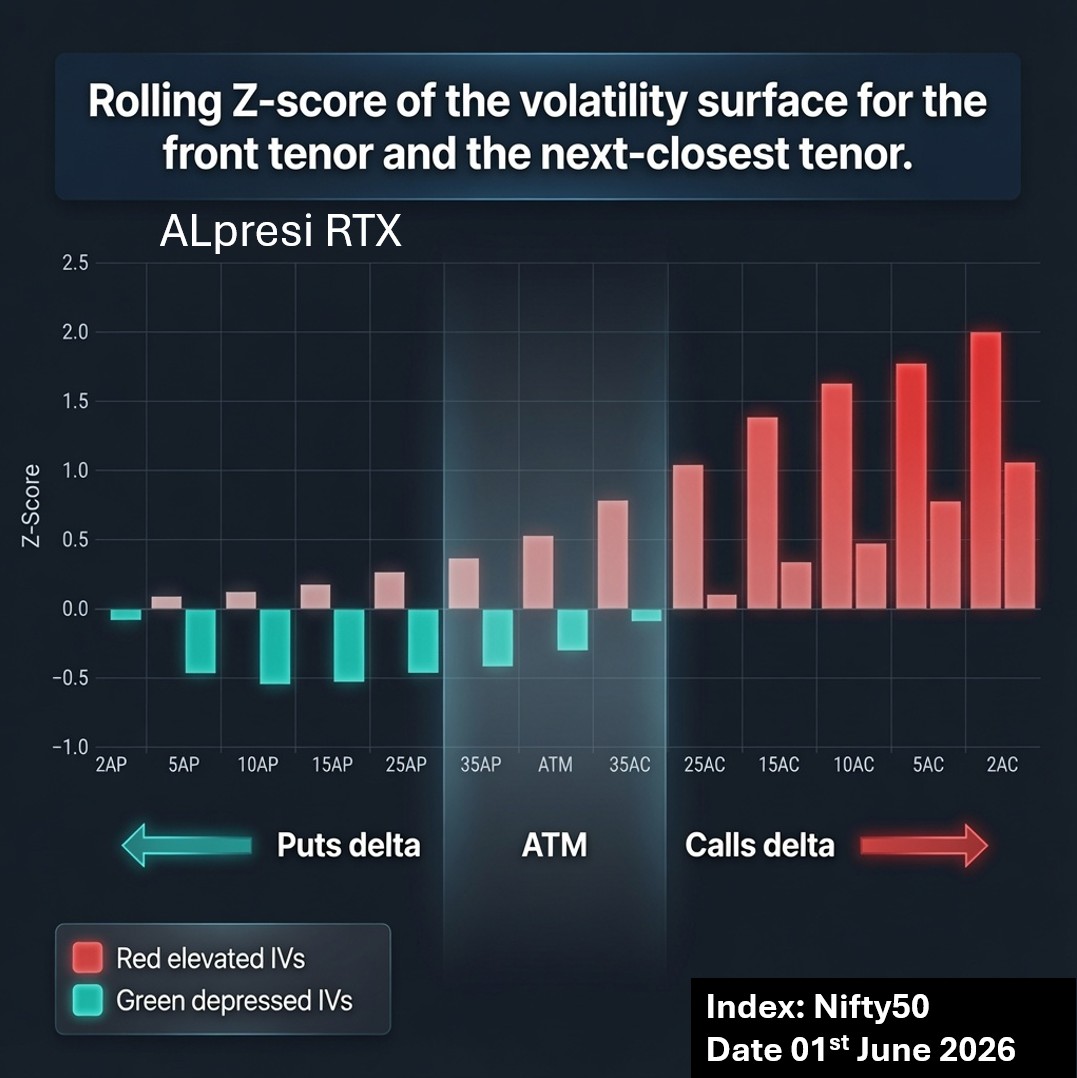
The chart below shows the Rolling Z-score of the volatility surface for the front tenor and next-closest tenor as of 01 June 2026: the day before expiry.
Reading the Volatility Surface Z-Score
This is not a simple IV chart. It shows how expensive or cheap implied volatility is across different strikes and tenor relative to its own recent history.
- Red bars = Elevated IVs (volatility is expensive compared to recent norms)
Teal bars = Depressed IVs (volatility is cheap compared to recent norms)
The x-axis is arranged from deep puts (left) → ATM → higher calls (right).
Key observations from 01 June 2026 data:
- Put side (left): Mostly negative Z-scores → IVs were depressed. Downside protection was relatively cheap.
- ATM region: Mildly mixed, hovering near zero.
- Call side (right): Strongly positive Z-scores, especially in the 10AC to 5AC strikes → IVs were significantly elevated. The market was paying up for upside volatility.
This created a clear reverse skew in the volatility surface- calls were expensive while puts were relatively cheap.
What This Meant for 02 June 2026: 0-DTE Expiry
On expiry day, the volatility surface acts as a map of dealer positioning and hedging pressure.
When call IVs are elevated (especially on higher strikes), it usually indicates one or more of the following:
- Heavy call buying by participants (retail or institutions).
- Dealers are short gamma ( Gamma flip was ~23370) on the upside and are forced to buy dips / sell rallies less aggressively.
- Skew positioning where the market is more worried about missing an upside move than a downside crash.
On 02 June, this setup played out clearly:
- Despite a weak opening (possibly due to global cues), the call-heavy volatility surface suggested limited fear on the downside.
- Elevated call IVs meant dealers were more likely to facilitate upside moves rather than aggressively sell into strength.
- The recovery in IT stocks found fuel because the volatility surface wasn’t pricing in heavy downside risk.
In simple terms: The surface was biased toward supporting upside pinning or a recovery rather than a sharp breakdown.
Institutional desks and sophisticated prop traders use volatility surface analytics because it reveals:
- Where volatility is rich vs cheap across the entire skew
- How the term structure is behaving between expiries
- Early signs of gamma flips and dealer hedging flows
This kind of granular, rolling Z-score analysis of the volatility surface across deltas and tenors is institutional-grade. Tools like ALpresi RTX (a proprietary platform) are designed exactly for this a real-time, multi-dimensional view of implied volatility dynamics that simple indicators cannot capture.
On 0-DTE days, when gamma is at its peak and every rupee move matters, this edge becomes even more valuable.
Final Takeaway
- The volatility surface on 01 June 2026 was quietly telling a story: “There’s more demand for upside volatility than downside. The market is not pricing heavy crash risk.”
- The price action on 02 June largely validated this a weak start followed by a steady recovery rather than a breakdown.
- For serious 0-DTE traders, watching not just where IV is, but how expensive or cheap it is relative to history across the skew, offers a significant informational advantage.
- This is the difference between decision on surface-level data and decision with institutional-grade volatility intelligence ((ALpresi RTX)