
🔍 Why Dealer Gamma Exposure GEX / Gamma Density Charts Don't Mean What They Claim in India.
A guide for Indian retail traders - so nobody can sell you a chart, or a course, that you cannot check.
The 9:20 AM ritual
It is 9:20 in the morning. NIFTY has been open for five minutes. Somewhere in Pune (India), a man who works in IT support (full time job) and stock market (part time) has already opened three apps.
The first is his broker. The second is X (social Media platform, like linkedin, Facebook, Instagram etc). The third is a Telegram channel he pays INR 2000 a month for.
On X he finds it: a beautiful chart. NIFTY strikes along the bottom. Green bars above the line, red bars below. A thick horizontal line labelled GAMMA FLIP-24850. Underneath, a caption written with total confidence:
"Dealers are short gamma below 24850. Break this and we accelerate. Above it, expect pinning. Positioning does not lie."
It has Greek letters. It has a professional colour scheme. It has the word dealers in it, which makes him feel he is finally seeing the machinery behind the curtain.
At the bottom of the thread is a link. The link goes to a course. He buys it.
This article is for him. Not because the chart is necessarily wrong- the physics behind it is real, and we will explain that physics properly: but because there is one question he never asked, and it is the only question that matters:
Where did that number come from ?
Not "is it right." Not "does this person seem smart." Simply: where did the number come from, and can it come from anywhere at all with the data available in India ?
For most of what gets posted, it cannot. And the reasons are worth understanding even if you never look at a gamma chart again, because they will teach you more about Indian market microstructure than the course will.
We are also going to flag popular arguments against GEX and Gamma Density that are simply wrong. If you repeat those in the replies you will get demolished, and the course seller will end up looking like the reasonable adult in the room. Accuracy is the entire point here. A piece attacking unverifiable claims cannot itself be built on unverifiable claims.
A note on who is writing this
This comes from a community that has been publishing gamma density and gamma exposure work for the Indian market since 2021-2022, in proprietary form, long before the current wave of social media (X, linkedin, Facebook, Instagram etc.) enthusiasm for it.
We are not writing this because people are using the terminology. Terminology is not property, and frankly the more people who understand gamma, the better for everyone.
We are writing it because of what happens next in that story. The man in Pune sizes up. The level breaks. He assumes he read it wrong, watches another video, and sizes up again. At no point in that loop has anybody told him that the central input to the chart is not measured: it is assumed.
He deserves to know that. Then he can decide for himself.
The Gamma Exposure (GEX) framework was originally developed by SqueezeMetrics (Ref. 1) and published as a whitepaper for the US market (SPX options).
"Gamma Density," however, is a distinct concept. The term was coined by (Ref. 2), who first published it on X (formerly Twitter) specifically for Indian indices -Nifty, Sensex, and BankNifty. This article was written under his direct guidance and is customized for Indian index derivatives. To the best of our knowledge, "Gamma Density" as a term and methodology has no prior commercial or exchange usage in US markets.
Unfortunately, many people are using the term ‘GEX/gamma density’ to mislead innocent retailers on social media ( X, linkedin, Facebook, Instagram etc.), all in an effort to ‘sell the course’ and these charts for some money. It’s quite amusing to see how these dishonest course sellers operate, trying to profit from the hard work and insights of the community. We believe in sharing knowledge and empowering traders, not exploiting them for personal gain.
Let’s continue to promote a genuine understanding of GEX and Gamma Density, ensuring that everyone can navigate the markets with confidence.
(1) First, what the claim actually is and it is a good claim
Let us be completely fair to the idea before taking it apart, because the mechanism underneath is genuine and well documented.
A market maker who sells you an option does not want a bet on NIFTY. They want the spread. So they hedge in NIFTY futures. Which direction they are forced to hedge depends entirely on which side of the option they hold:
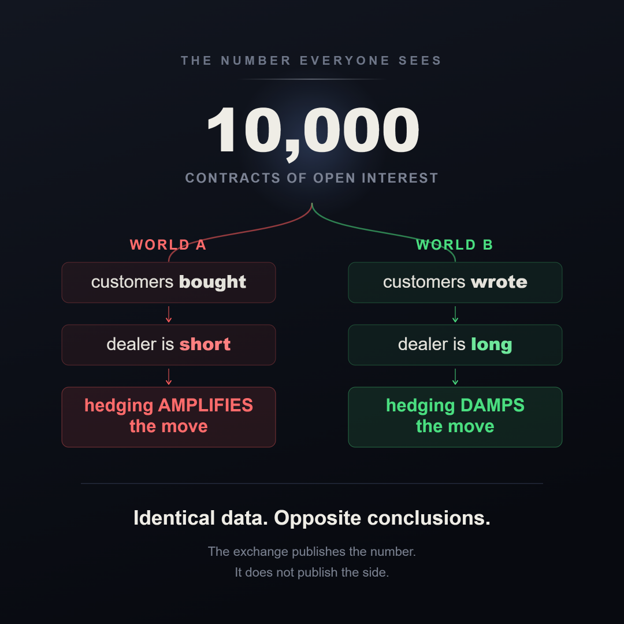
- Short options → as NIFTY rises they must buy futures; as it falls they must sell. Their hedging amplifies the move.
- Long options → the opposite. They sell rallies and buy dips. Their hedging damps the move.
Short gamma amplifies. Long gamma damps.
The beautiful part is that none of it involves opinion. A market maker does not need to believe NIFTY is going up in order to buy futures. The hedge simply requires it. That is what makes gamma different from ordinary support-and-resistance analysis, and it is why the idea is so seductive; it promises a view of mechanical pressure rather than crowd psychology.
So if you knew where dealers were heavily short gamma, you would know which price levels behave like tripwires: quiet while price sits away from them, violent once price breaks through.
That mechanism is real. Nobody serious disputes it.
The question is whether anyone in India can measure it.
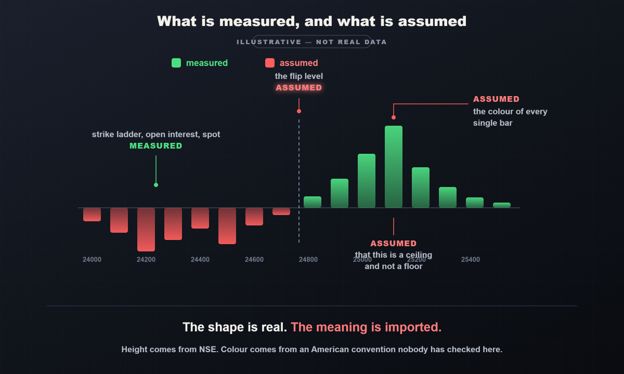
(2) Two different charts, Both are wrong and both of them has problem
Before we go further we must separate two things that get used interchangeably, including by people who should know better. The difference is one symbol: and that one symbol is the entire subject of this article.
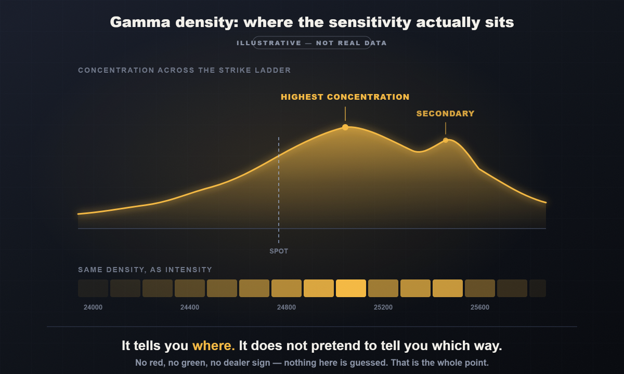
Gamma Density is intended to measure the concentration of option sensitivity across the strike ladder. However, the prevailing Gamma Density models are structurally flawed; they artificially force a bell-curve shape by over-weighting open interest (OI). This bell curve is merely an artifact of multiplying OI by the Gamma Greek, which inherently follows a normal distribution under the Black-Scholes framework. Any Gamma Density chart that mirrors a smooth, symmetrical bell curve should be viewed with skepticism, as it reflects the mathematical properties of the model rather than true market dealer positioning. Recently, various actors have used AI/AI Agent (LLMs) to crudely replicate the original Nifty Gamma Density frameworks pioneered by Ref.(2).
Gamma Density:
gamma × open interest × multiplier × spot²
Nothing; it is guesswork modeling to fit the bell curve shape. Wrong model, wrong assumptions, wrong interpretations.
Gamma Exposure (GEX) takes that same quantity and attaches a direction to it:
s × gamma × open interest × multiplier × spot²
That little s is the dealer sign. It is +1 if dealers are long that contract, −1 if they are short. It is what converts a neutral concentration map into a directional claim about who gets hurt and which way price will run.
Everything in this article is about that GEX/Gamma Density.
Gamma Density is wrong model, forced fit using AI/LLM agents. GEX is Gamma Density multiplied by a number that nobody in India can observe. Hold that distinction in your head as you read, because we will come back to it at the end-and it is where the good news lives.
(3) The single fact that settles most of this
Here is what almost nobody selling these charts in India will mention.
In America, nobody calculates dealer gamma. They buy it.
CBOE and NYSE sell a data product called the Open-Close Volume Summary. For every single option series, it reports each trade broken down by:
- who traded : customer, professional customer, firm, broker-dealer, or market maker
- which side : buy or sell
- what it did to their position : opening or closing
Available end-of-day, or as intraday feeds at one-minute and ten-minute snapshots.
Read that list again slowly, because it is precisely, item for item the exact information required to compute the dealer sign. It is not inferred. It is not modelled. It is published, per strike, and sold as a subscription.
The reason it exists is a plumbing accident. In the US, every options order must be tagged "to open" or "to close" so the clearing house can compute open interest. The exchanges collect that tag anyway, so they bundle it and sell it.
NSE publishes nothing equivalent at strike level. There is a participant-wise open interest report :- Client, Pro, FII, DII which is genuinely useful and completely free, and you should look at it. But it is index-level and end-of-day. It will never tell you who is short the 24700 call.
So when an American posts a GEX chart, they are showing you the output of a paid data feed.
When an Indian posts one, they are showing you the output of a guess.
Ask which one you are looking at. That single question ends most of these conversations, usually with a block.
(4) The deeper problem: India may not have a "dealer" at all
Suppose the data problem vanished tomorrow. There is a larger issue underneath, and this one nobody states out loud.
The entire framework assumes there is a party who warehouses a large option position for weeks and hedges it mechanically in the underlying. In America that party genuinely exists, and there are only a handful of them. They carry enormous books. They hedge continuously because their risk limits give them no choice. Their inventory is the gamma exposure. When you compute US GEX, you are describing a real, identifiable, persistent pile of risk sitting on a few balance sheets.
Now ask who holds that pile in NIFTY.
Prop and HFT firms provide most of the liquidity, and most go home flat or near-flat. A book that ends the day flat carries no gamma into tomorrow. There is nothing to hedge at 9:15 the next morning.
Institutional and HNI writers overwhelmingly run defined-risk structures - iron condors, credit spreads, calendars. Their gamma is capped and localized by design rather than open-ended.
Retail writers are margin-constrained and typically hold to expiry without hedging at all. Ask one of them whether they recompute portfolio delta every three minutes and rebalance in futures. Then watch their face.
If nobody accumulates persistent, unhedged short gamma, then even a perfect measurement predicts nothing- because there is no forced hedging flow behind the number for you to front-run.
We want to be honest that this is reasoning about market structure, not something we have measured. But it is the load-bearing assumption of the entire framework, and we have never once seen it defended by anyone selling these charts. Not argued badly -never addressed at all.
(5) Weekly expiries destroy the thing that makes it a strategy
The American literature grew up around monthly and quarterly SPX positioning that sits in the market for weeks. A gamma level that has existed for a month is a genuine feature of the landscape. It deserves a line on a chart.
NIFTY resets the entire book every week.
We looked at the complete tick history of one NIFTY strike through a full expiry cycle. Open interest at that strike went from 2202 lots to 68261 lots in a single session :a thirty-fold jump in one day. Essentially the whole position was built in the final four sessions before expiry.
A "level" that comes into existence on Friday and is gone by the following Tuesday is not a structural feature of the market. It is this week's positioning, and next week it will be somewhere else entirely. You cannot build a repeatable strategy on an object with a four-day lifespan.
The lifespan problem, not a data problem
There is a related point that gets stated wrongly, so let us be careful.
You will sometimes hear that NSE's three-minute open interest refresh makes the data "stale" or "dead" by the time it is plotted. That argument is backwards, and if you repeat it you will be corrected instantly -because US open interest is a prior-night snapshot that does not update at all during the session. Every American gamma chart runs on yesterday's numbers all day long.
Three minutes is not stale next to eighteen hours.
The real issue is not how fresh the data is. It is how short the position's life is relative to the refresh.
Look again at the expiry-day data from that strike. Between 09:15 and 09:42 twenty-seven minutes open interest went from 7.78 million units to 19.43 million. It then collapsed back below 9 million by 10:45.
Three minutes of a NIFTY expiry-day position is a meaningful slice of that position's entire existence. Three minutes of a monthly SPX position is nothing at all.
So the same refresh rate that is a genuine advantage for India in absolute terms becomes inadequate in relative terms, purely because the thing being measured turns over so much faster. Both statements are true simultaneously. Say it this way and nobody can knock it down.
And it is expiry concentration, not American-style 0DTE
One more precision point, because people get this wrong constantly.
The US has SPX contracts expiring every single trading day. India has one weekly expiry per index - one zero-day session per week per instrument:and SEBI has moved to rationalise weekly expiries rather than expand them.
So India does not have daily 0DTE. It has something arguably worse for gamma analysis: expiry-day concentration. Instead of gamma spreading across five expiries a week, the entire book's gamma detonates on one predictable day and then vanishes. Positioning does not decay gently. It is created over four days and destroyed in six hours.
Call it what it is. If you call it 0DTE, someone will correct you, and the correction will be right.
(6) Long-dated open interest: technically available, practically dead
This is the first popular argument people get wrong, so let us state it carefully.
It is not true that India has no LEAPS. NSE lists quarterly and half-yearly NIFTY option contracts, and SEBI permitted index options with tenures up to five years back in 2010, having already extended it to three years in 2008. The contracts exist. You can pull up March, June and September expiries right now.
What is true is that they are effectively dead. Short-dated contracts have long dominated at roughly 90% of NSE trades, only a handful of negotiated deals ever happen in the long-dated market, and brokers routinely warn clients to exit long-dated positions early because of liquidity problems.
Why does that matter? Because in America a meaningful share of dealer gamma sits in LEAPS and quarterlies. That inventory is sticky. It does not reset. It provides a stable base layer of positioning persisting across weeks and months -the geological bedrock underneath the weekly noise.
India has essentially none of that bedrock. Nearly all Indian option gamma lives in contracts with days to run.
Notice how much stronger the corrected version is. "India has no LEAPS" is false and gets refuted in one reply. "India has LEAPS and the market has comprehensively refused to trade them" is true, verifiable, and tells you something real about how this market actually behaves.
(7) Huge volume is not the same as huge positioning
Second popular argument people get backwards, and this correction matters most.
Yes, retail participation in Indian options is enormous. NSE is the world's largest options market by contracts traded. Everyone treats that as proof that gamma effects must be enormous here.
It cuts the other way.
Retail flow is churn. We measured this directly on real NIFTY tick data across a full expiry cycle:
The typical three-minute window moves open interest by only about 11% of the volume traded in it.
Roughly 89% of all Indian option trading creates no position whatsoever.
It is people passing contracts back and forth intraday. Bought at 10:15, sold at 10:40, nothing left behind at all.
So "India has huge options liquidity" is misleading in a very specific way. Turnover is huge. Depth is thin. The order book is being eaten and refilled continuously.
High turnover with thin depth and almost no position creation is close to the exact opposite of the deep, sticky, warehoused inventory that makes gamma exposure meaningful in the first place.
(8) The sign convention on Indian GEX charts is probably backwards
Now the part that should genuinely worry you.
The standard GEX formula: the one every public tool uses- assumes:
dealers are LONG calls and SHORT puts
That assumption arrives with an American story attached: institutions write covered calls for yield (leaving dealers long calls), and buy puts for protection (leaving dealers short puts). It is a perfectly reasonable description of US institutional behaviour.
It is a description of American behaviour.
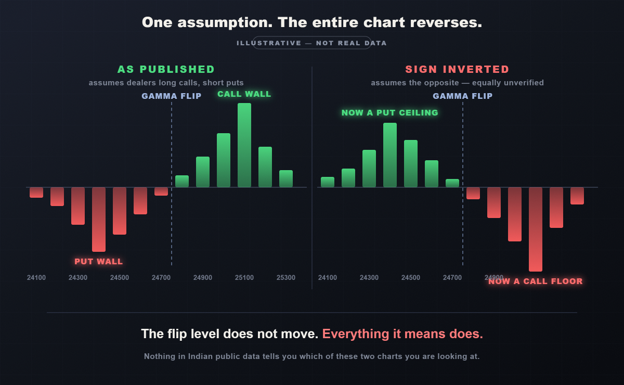
If the Indian option-selling side is structurally different - and everything about this market suggests it is then importing that convention does not merely make the chart noisy.
It makes it sign-inverted.
Your "positive gamma zone" is a negative gamma zone. Your "market gets pinned here" level is a "market accelerates here" level. Your Call Wall is a Call Floor.
That is worse than having no chart at all, because a wrong chart makes you confident. A trader with no chart hesitates. A trader with an inverted chart sizes up.
When we ran this properly on real NIFTY data, the estimate came back short on both the call and the put leg- the opposite of what the American convention assumes for calls. We do not have enough evidence to insist that is correct. But neither does anyone using the default formula, and they are the ones drawing lines on charts and selling access to them.
There is a specific reason to suspect the call side is inverted - and you can check it yourself
The American convention justifies "dealers long calls" with that covered-call story, leaving dealers on the buying side.
There is a plausible argument that the Indian call side runs the other way: that domestic institutions and sophisticated retail aggressively write out-of-the-money calls to harvest decaying premium in range-bound regimes. If that is right, dealers are buying very little and short a great deal, and a "Call Wall" computed with the American convention is structurally upside down.
But notice what that argument is. It is a specific directional claim about Indian positioning - which is precisely the quantity this entire article says nobody can observe. We are not going to assert it. That would be doing the exact thing we are warning you about, in the middle of the warning.
Here is the good news: on this one point, you can actually check. NSE's participant-wise open interest report publishes index call long and short positions broken out by Client, Pro, FII and DII. Free, and daily.
Pull three months of it. Look at whether the Pro category is persistently net short index calls. If it is, the American convention is inverted for India on the call leg, and every tool using the default formula has its Call Wall backwards. If it is not, drop the argument and move on.
That is the difference between analysis and assertion, and it costs you one afternoon.
(9) Even the shape of the chart may be wrong
Now the part that should worry the chart-sellers more than anything above.
Every GEX chart you have seen on Indian fintwit shows a level. A gamma flip line. A call wall. A put wall. Horizontal lines drawn across price like tram tracks.
But there is a growing argument in the research - theoretically hard to dispute - that the informative quantity is not the level of dealer gamma at all. It is the change in dealer positioning.
The logic is simple once you see it. Dealers do not trade because they hold gamma. They trade because their required hedge changes. The hedging flow is roughly (gamma × price move) -a change quantity by its very nature. A dealer sitting on an enormous but static book generates no flow at all. A dealer whose position is shifting generates flow even when the level looks unremarkable.
If that is right, the horizontal line on the chart is measuring a stock when the mechanism is about a flow.
Which means the typical GEX chart is running a formulation that serious researchers are already moving away from -layered on top of a dealer-sign assumption that cannot be verified in India, computed from data that cannot support it. Three problems stacked, not one.
Two honest caveats, because this argument also gets oversold.
First, watch for the word "contemporaneous." Gamma is a mathematical function of spot price. When NIFTY moves, every strike's gamma changes automatically -no dealer has to do anything at all. So the change in GEX contains the day's return by pure arithmetic. Anyone claiming that gamma positioning change "explains same-day returns" must first show their result beats the purely mechanical version, computed by freezing open interest and the dealer sign and simply revaluing at the day's close. If they cannot show you that null, the finding may be an accounting identity wearing a lab coat.
Second, explaining today's move is not predicting tomorrow's. If a measure only becomes computable after the return it explains has already happened, it is a description, not a signal. Ask which one is on offer.
And it does not rescue the Indian case anyway. A change-based measure still gets multiplied by the same unknown dealer sign. Get that backwards and the change measure inverts exactly as the level measure does.
What it does do -worth knowing if you ever build something yourself -is remove two of the objections above. A same-day change measure does not need positions to persist, so the weekly-expiry problem stops mattering. And it never accumulates period after period, so it cannot drift away from reality the way a running position total does. If you build anything in this space in India, build the change version.
(10) Margin rules push Indian writers away from open-ended short gamma
A structural difference that gets almost no attention, and it matters.
In the US, institutional market makers operate under portfolio margin. Risk is assessed across the whole book, permitting very large open-ended short-gamma positions financed with modest capital. That is precisely the inventory that generates continuous hedging flow.
In India, SEBI enforces upfront margin and intraday peak margin reporting. Capital is blocked against positions far more rigidly. The rational response-and you can see it in how Indian desks actually trade - is to build structures that minimise margin consumption: spreads rather than naked shorts, defined-risk rather than open-ended.
That changes the character of the gamma sitting in the market. But be careful how you state it, because the strong version is wrong and someone will catch it.
A spread is not gamma-neutral. Short a 24,700 call and long a 24,800 call and you are net short gamma near 24,700 and net long gamma near 24,800. The gamma has not vanished it has been localised between the strikes and capped in size. There is still hedging flow. It is simply bounded, and it flips sign across a narrow price band instead of running open-ended.
So the honest claim is not "these positions generate zero hedging flow." It is that margin rules bias the Indian market toward smaller, strike-localised, sign-flipping gamma rather than the large open-ended short-gamma inventory the GEX framework was built to describe.
One correction while we are here. If anyone tells you Indian desks run box spreads to harvest premium, they have the instrument wrong. A box is a financing trade - delta and gamma neutral by construction, used to lend or borrow at an implied rate. Nobody runs one for premium. Calendars are the better example, and note that a calendar is short front-month gamma, which is exactly the gamma that matters most here.
(11) The question nobody selling you a chart will answer
In our view this is the strongest objection of all, and it requires no data whatsoever to state.
The framework is a chain, and every link must hold:
someone holds short gamma → that someone dynamically delta-hedges → they hedge in NIFTY futures or cash → in size large enough to move the market
Break any link and the number on the chart is inert. The second link is the weak one.
The HFT and prop desks providing most Indian option liquidity run co-located automated market-making, but largely flatten their books or trade delta-neutral structures from inception.
The large retail and HNI writers supplying much of the remaining premium execute manually or through basic API bots. They are not computing real-time portfolio delta and mechanically rebalancing in NIFTY futures every few minutes. Faced with a fast move, they typically do one of three things: nothing, close the position, or roll it. All three break the chain. Only "hedge delta in futures" produces the amplification the model predicts.
This is reasoning about market structure, not something we have measured so we would rather hand you a question than a claim we cannot back:
Has anyone selling you a gamma chart ever shown that the hedging flow actually exists?
It is directly testable. If dealers were hedging gamma at these levels, NIFTY futures volume and order-flow imbalance should spike as price crosses concentrated-gamma strikes, beyond what the spot move alone accounts for. That is a measurable, falsifiable prediction of the theory.
Ask for it. If nobody has ever looked, you now know the chart's central assumption has never been checked by the person charging you for it.
(12) The wrong argument: "short selling isn't allowed in India"
Do not use this one. It is false, and it will cost you the argument.
Short selling is permitted in India for all categories of investor, retail and institutional alike, and every stock in the F&O segment is eligible. What is prohibited is naked short selling - selling without first borrowing. You must honour delivery at settlement, which is what the Securities Lending and Borrowing mechanism exists to enable. Institutions must flag a short sale upfront; retail can disclose by end of day.
More importantly: for index gamma it is irrelevant anyway. Nobody hedges NIFTY option gamma by short-selling stocks. They hedge with NIFTY futures, which carry no short-selling restriction whatsoever.
There is a real version of this argument, and it applies to single-stock gamma rather than index gamma. Hedging short gamma in a single stock genuinely requires shorting that stock, and the Indian SLB market is thin. So single-stock gamma charts face a hedging-friction problem that NIFTY charts do not.
If you are going to make the point, make that one.
(13) End of Game --> An affectionate field guide to the Gamma Exposure (GEX)/Gamm Density Seller Course
We promised not to accuse anyone of dishonesty, and we will keep that promise. Most people posting these charts have probably never confronted the dealer-sign problem and never decode Gamma density frame work originally created for Indian Indices for proprietary work by Ref(2) at all- because if they had, they would have hit exactly the wall described above and stopped.
But the genre has developed some remarkably consistent conventions, and those we can describe freely.
- The Screenshot That Only Works Yesterday. Every example is from a past session, annotated after the fact, with arrows added in a colour that suggests inevitability. The level is always drawn on a day it held. On the days it did not, everyone was apparently busy.
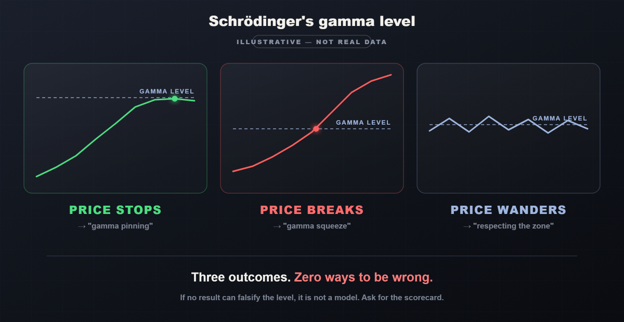
- Schrödinger's Level. If price stops at the line, that is gamma pinning. If price blows straight through, that is a gamma squeeze. If price wanders around nearby doing nothing in particular, that is the market respecting the zone. At no point does any outcome count as the level having failed. This is not a model. It is a horoscope with Greek letters.
- The Vocabulary Escalation. Year one it is "GEX." Year two it is "Gamma Density." Year three it is "Charm-Adjusted Vanna Flow Regime Mapping." The underlying spreadsheet has not changed. Somebody added a column and a colour gradient.
- The Institutional Tense. Nobody says "I think." Everybody says "dealers are positioned." This is grammatically clever: it shifts the claim from a person who could be wrong to an anonymous institution that apparently cannot be. Watch for it. "Dealers are short gamma here" does enormous unearned work compared to "I am assuming dealers are short gamma here, using a convention imported from a market with completely different participants."
- The INR 4999 Threshold. Somewhere in the funnel, a number appears. It is never INR 5000. It is INR 4999. This has nothing to do with gamma but we find it consistently fascinating.
The One Question That Ends It. Ask, politely: "How do you determine whether dealers are long or short at each strike ?"
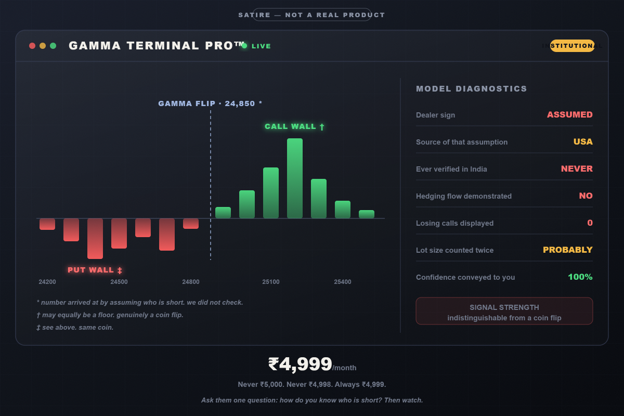
There are exactly three possible replies. "We use the standard convention" is the honest one, and it means the answer is an assumption. "Proprietary model" means the same thing wearing a suit. And silence -or a block- is also an answer.
None of this proves anybody is lying. It shows the genre has developed habits that make claims unfalsifiable; and unfalsifiable claims sell far better than honest ones. That is a structural problem more than a moral one. The market for certainty is enormous. The supply of actual certainty is very small. Something has to fill the gap.
(14) Six questions to ask anyone selling you a gamma exposure/ gamma density chart
Any one of these will do.
1. Where does your dealer long/short assumption come from ? No Indian data source publishes it per strike. If they say "we use the standard convention," they have imported an American assumption without checking whether it applies. Ask what happens to their chart if it is inverted. The honest answer is "everything flips."
2. Is your open interest intraday or end-of-day ? Small mercy -India is genuinely better than the US here. NSE refreshes open interest roughly 126 times a day, about every three minutes, while US open interest arrives from the clearing house end-of-day only. If an Indian tool is not using intraday refreshes, it is discarding the one real advantage this market has.
3. Are your open interest figures in quantity or in lots ? NSE publishes quantity, which means the lot size is already baked in. Multiply by the lot size again and every number is 75 times too large. It is a uniform scale error, so the chart looks completely normal-it only surfaces when you compare against someone else's figures. Ask them. Watch what happens.
4. Show us the losing calls. Ask for a scorecard: how often does price respect the level, measured against what baseline? If there is no falsification criterion, it is not analysis.
5. Have you tested whether the hedging flow actually exists ? NIFTY futures volume should spike as price crosses concentrated-gamma strikes, beyond what the spot move alone explains. Directly testable. Has anyone shown it ?
6. Are you showing me a level or a change ? If hedging flow depends on how positioning is moving, a horizontal line at a static level is the wrong object. And if they answer "change," ask the follow-up: does it beat the purely mechanical version, where gamma is simply revalued at the new spot with nothing else altered ? Almost nobody has computed that null.
(15) Test the mechanism yourself - no fancy data required
This is the part we like most, because you can do it with an ordinary broker feed and no assumptions about who is short.
Both tests examine the mechanism, not anyone's estimate of it.
Test 1 : do high-gamma strikes behave differently ? Take strikes with large near-dated open interest. Compare what happens when NIFTY crosses them against what happens crossing comparable strikes with little open interest. Look at continuation over the next thirty minutes, and at realized volatility expansion. No dealer sign required anywhere. If there is no difference, the mechanism is not transmitting and every gamma chart in India is decoration.
Test 2 : is there hedging flow in the futures ? When NIFTY crosses a high-open-interest strike, does NIFTY futures volume and order-flow imbalance jump beyond what the price move alone would produce? That is the middle link in the chain. If you cannot find the hedging, the chain is broken.
That is roughly a week of work and it answers the actual question. Do it before you spend a rupee on a course or a data subscription - because if the mechanism does not transmit here, better data only buys you a more precise measurement of something that does not matter.
(16) Structural summary: USA versus India
| Feature | United States | India |
|---|---|---|
| Dealer positioning data | Reported by the exchange and sold - Cboe and NYSE Open-Close, per series, intraday | No strike-level equivalent. Must be inferred from public open interest |
| Open interest freshness | Prior-night snapshot, static all session | Refreshed roughly every 3 minutes - genuinely better |
| Position lifespan | Weeks to months | Days; built over a week, destroyed on expiry day |
| Long-dated inventory | Meaningful base layer in LEAPS and quarterlies | Contracts exist up to multi-year but are effectively untraded |
| Who holds the gamma | Small number of dedicated market makers warehousing inventory | Prop and HFT desks that flatten, plus retail and HNI premium writers |
| Margin regime | Portfolio margin permits large open-ended short gamma | Upfront and peak margin favour spreads and defined-risk structures |
| Hedging behaviour | Automated, continuous delta rebalancing | Largely untested -much of the writing side likely does not rebalance |
| Turnover vs positioning | Volume broadly reflects position change | Roughly 70-90% of volume creates no position at all |
Read down the India column. Every row is either worse, unverified, or structurally different in a way the model does not account for -with exactly one exception, and it is an advantage almost nobody is using.
(17) What we are not claiming
We want to be careful here, because overstating the case is precisely how you become the thing you are warning against.
- We are not saying the physics is fake. Delta hedging by short-gamma dealers genuinely amplifies price moves. That is real and it operates everywhere, including here.
- We are not saying it is impossible in India. We are saying the inputs are a purchased data product in America and an unsolved inference problem here due to DMM existence.
- We are not saying US GEX prints money. It is measurable there. Whether it is profitable is separately contested -plenty of American practitioners regard published GEX levels as widely known and therefore already arbitraged away.
- We are not saying everyone selling this is dishonest. Most have simply never confronted the dealer-sign problem, because if they had, they would have hit the same wall we did.
- And we are not saying gamma analysis is useless in India. Quite the opposite - which brings us to the only genuinely constructive thing in this article.
(18) The one-line version
In America, dealer gamma is bought from the exchange. In India, it is guessed at -and nobody selling you the chart will show you their guess.
Ask where the number comes from. If they cannot answer in one sentence, you now understand their model better than they do.
The man in Pune with the three apps open does not need a better chart. He needs one question. Now he has six.
Acknowledgments & Data Sources:-
(1) This research builds on the foundational Gamma Exposure (GEX) framework developed by SqueezeMetrics. We highly recommend their original whitepaper for a deep dive into options-driven market liquidity and dealer hedging flows: Gamma Exposure (GEX): Quantifying hedge rebalancing in SPX options https://squeezemetrics.com/monitor/download/pdf/white_paper.pdf
(2) The proprietary Gamma Density charts and methodology for Indian indices (Nifty, Sensex, Bank Nifty, etc.) are based on the guidance of Pankaj Ji MathuraWale, as shared through his posts on X
Disclaimer: The content of this post is purely educational and derived from standard textbooks. It does not constitute investment or trading advice, including the buying or selling of indices, in any financial market.

0 comments
No comments yet. Start the discussion.
Leave a comment
Your email is required but never shown publicly.