
Nifty has rallied 12.6% in four weeks, from 22,232 on 8 October to 25,030 on 6 November 2026, and foreign investors have suddenly turned buyers. The price chart says the bull is waking up. The options market says: not so fast.
We studied seven years of Nifty price, options and institutional-flow data to find the fingerprints every genuine Indian bull market has left behind. Today, only some of them are back. Our verdict: this is a real recovery attempt, but not yet a confirmed bull phase. It is "prove it" territory, and the next few weeks decide whether it is a bull run or a bull trap.
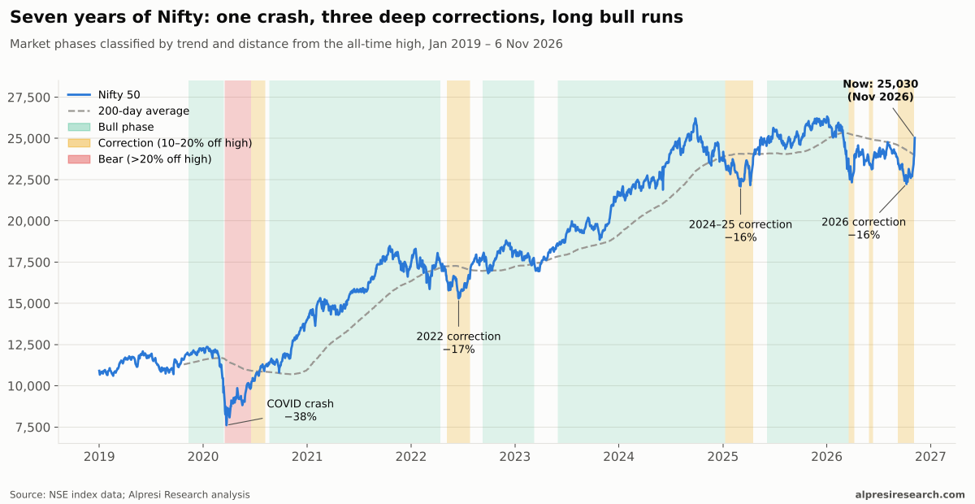
Seven years of Nifty in one picture
Since 2019, Nifty has had one true bear market and three deep corrections. The COVID crash of 2020 cut 38% off the index. The three corrections, in 2021–22, 2024–25 and 2026, each took 15–17% off the high and needed 5 to 15 months to recover.
The 2026 fall bottomed twice: at 22,331 on 30 March and at 22,232 on 8 October. Chartists will call that a potential double bottom, and the November rally has been fast.
Nifty 50 with 200-day average and market phases, 2019 to Nov 2026
| Year | Nifty return | Deepest fall within the year | Market phase |
| 2026 (to 6 Nov) | −4.2% | −15.6% | Correction, now attempting a turn |
| 2025 | +10.5% | −8.7% | Recovery, then bull |
| 2024 | +8.8% | −10.9% | Bull until September, then correction |
| 2023 | +20.0% | −7.1% | Bull, the cleanest of the period |
| 2022 | +4.3% | −16.5% | Correction, then sideways |
| 2021 | +24.1% | −10.1% | Bull |
| 2020 | +14.9% | −38.4% | Crash, then a powerful bull |
| 2019 | +11.8% | −11.4% | Mild bull |
The four fingerprints of a genuine bull market
Price tells you where the market has been. Options tell you what traders are willing to pay for what comes next. Across seven years of Nifty weekly options, every real bull phase shared four traits.
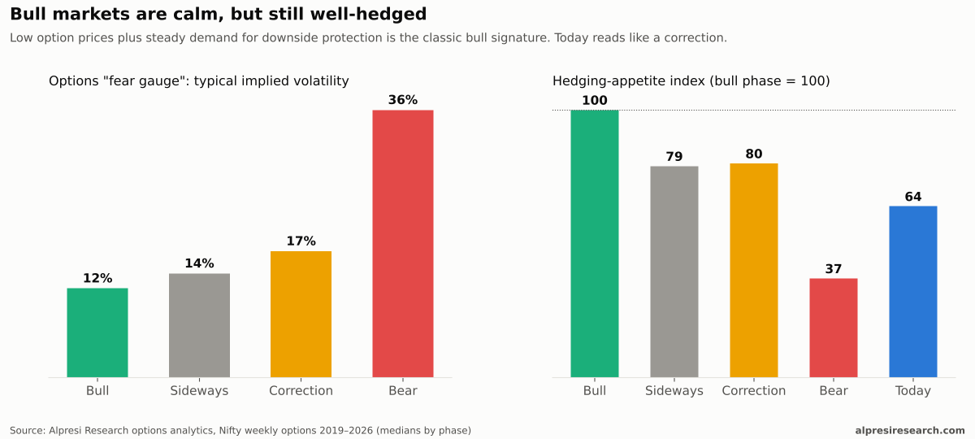
- Calm option prices. The options "fear gauge" (implied volatility) sits near 12% in bull phases, against 17% in corrections and 36% in a bear market.
- Calm, but hedged. In healthy bull markets, investors keep buying downside protection even when nothing feels wrong. Our hedging-appetite index averages 100 in bull phases, about 80 in corrections and 37 in a crash. Historically, when hedging appetite was strongest, Nifty's next three months were among its best, with the shallowest dips.
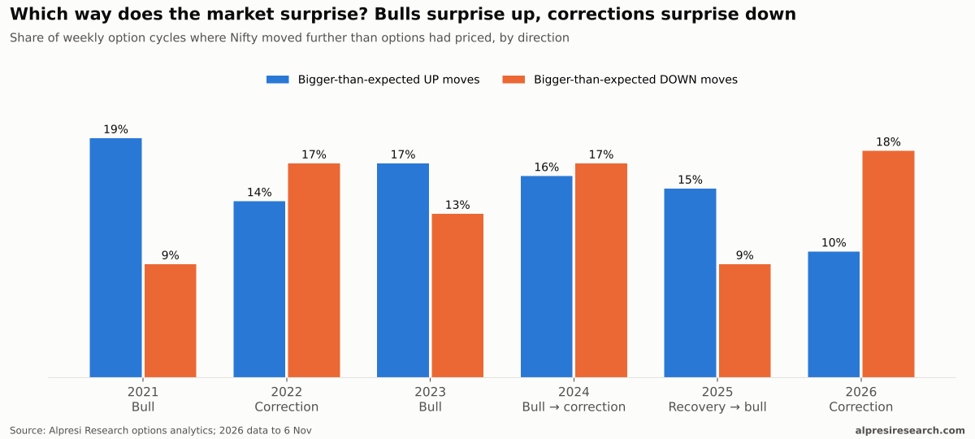
- Surprises to the upside. In bull years, Nifty more often moves further up than options expected. In corrections the surprises flip to the downside.
- Fear that fades. In a bull market, spikes in option prices fade fast because the feared move rarely arrives. In normal years options overpriced the actual move in roughly three of every four weeks. In 2026 that fell to about six in ten, the weakest reading in our data.
Options fear gauge and hedging-appetite index by market phase
Direction of bigger-than-expected Nifty moves by year, 2021 to 2026
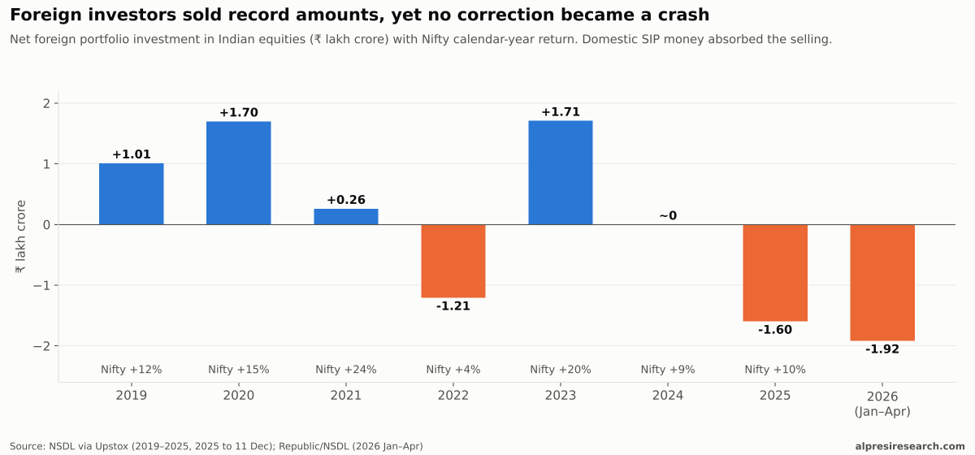
Follow the foreign money
Foreign investors have sold Indian equities on a historic scale: ₹1.21 lakh crore in 2022, ₹1.60 lakh crore in 2025 and a record ₹1.92 lakh crore in just the first four months of 2026. Yet no correction since 2020 turned into a crash. Steady SIP money flowing through domestic institutions absorbed the selling each time, which is a big reason Indian corrections have stopped at 15–17%.
The cleanest bull runs, such as 2023 and the 2020 recovery, came when foreign buying and calm options lined up together.
Annual net foreign portfolio investment in Indian equities vs Nifty return
November 2026 brought a sharp U-turn. After selling about ₹44,000 crore in September and ₹45,000 crore in October, FIIs bought ₹49,559 crore in six straight sessions to 6 November, including ₹13,750 crore on 6 November alone. Domestic institutions sold into the rally to book profits.
FII vs DII monthly cash flows, Sep to Nov 2026
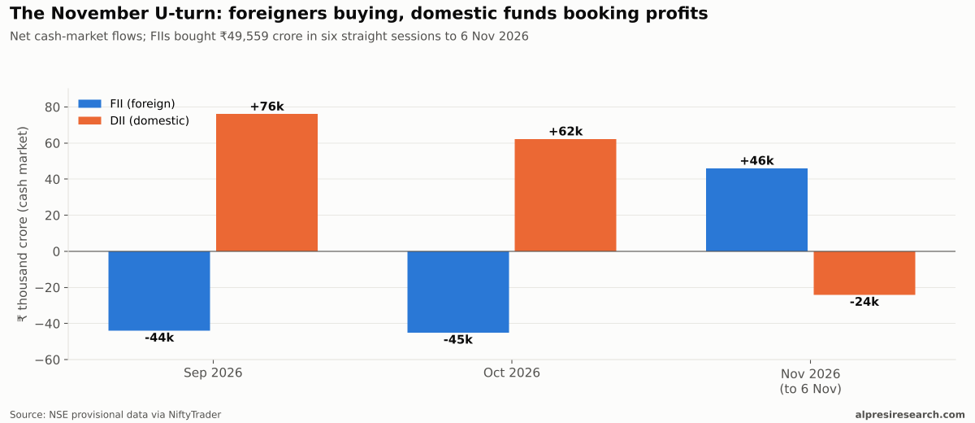
One caution: FIIs are buying shares while still holding heavy bearish bets in index futures, roughly one long contract for every three short. If they cover those shorts, the rally gets more fuel. If cash buying stalls while the shorts stay, the rally looks more like a bounce.
Bull run or bull trap ? The scorecard
Of eight signals, two say bull, two are turning and four still say correction.
| Signal | What a bull phase looks like | Reading on 6 Nov 2026 | Verdict |
| Distance from the record high | Within 10% | −4.9% (record 26,329) | Bullish |
| Price vs 200-day average | Above a rising average | 25,030 vs ~24,000, but the average is still falling | Bullish, early |
| 50-day vs 200-day average | 50-day above 200-day | 50-day ~23,250, still below | Not yet |
| Options fear gauge | Near 12% | ~18.7%, upper third of its history | Not yet |
| Hedging appetite | Near 100 | 64 | Not yet |
| Direction of surprises | More upside than downside | 2026 mostly downside; recent weeks upside | Turning |
| FII cash flows | Sustained buying for a month or more | Six sessions of buying | Turning |
| FII index futures | Shorts being covered | About 1 long for every 3 short | Not yet |
One more clue: traders are now paying more for upside calls than for downside puts. That is rare, seen only about 15 times since 2019. Right after a correction it has tended to come before further gains (2020, early 2025). Near a top it has come before pullbacks (late 2019, early 2020, late 2024). It tells us traders are chasing the upside, not which way the market goes next.
What would confirm the bull and what would spring the trap
Signs of a bull run:
- Nifty holds above ~24,000 (the 200-day average) on any pullback, then clears the August high zone of 24,800–25,000 for good.
- The 50-day average crosses above the 200-day (a "golden cross").
- The options fear gauge settles back toward 12–14% and hedging appetite rebuilds toward bull-phase levels.
- FII buying continues for a full month and their index-futures shorts get covered.
Signs of a bull trap:
- Nifty closes back below ~24,000 and the 200-day average keeps falling.
- FII cash selling resumes while their futures shorts stay in place.
- Downside surprises return: the market falls further than options priced, week after week.
So far the rally has the price momentum and the foreign money of a new bull market, but not yet the calm, hedged confidence that every lasting Indian bull run has shown. Watch the next three to four weeks.
Disclaimer and sources
This article is for educational and informational purposes only and is not investment advice or a recommendation to buy or sell any security. Historical patterns may not repeat. Please consult a SEBI-registered investment adviser before making investment decisions.
Price data: NSE Nifty 50 index, Jan 2019 – 6 Nov 2026. Options analytics: Alpresi Research, proprietary. Flow data: ALpresiRTX

0 comments
No comments yet. Start the discussion.
Leave a comment
Your email is required but never shown publicly.