ALPRESI RESEARCH is thoughtfully uncovering the myths of financial markets, marking a first-of-its-kind approach in the history of derivative markets.
Every trader grows up learning one unbreakable rule: Stocks up → Volatility down.
But lately, global indices such as the S&P 500 (a.k.a. SPX), Nifty, etc. have been happily breaking that rule: indices are rising while the VIX is also climbing.
This “feels wrong” behavior isn’t a glitch. It’s the signature of a rare but powerful options regime driven by Vanna Hedging.
Here’s everything you need to understand what’s happening, why it happens, and how to learn from it.
1. Traditional Behavior: The Classic Inverse Relationship
Under normal conditions, market makers are heavily short gamma below spot: primarily from selling OTM puts to institutions buying protection and normally on upside a lot of OTM call buying (opposite harvesting yield).
When volatility spikes:
- Those puts become more negative delta.
- Dealers must sell the underlying to stay delta-neutral.
- Result → Spot falls as vol rises.
This reliable negative spot-vol correlation explains why crashes come with VIX explosions and calm uptrends usually see collapsing volatility.
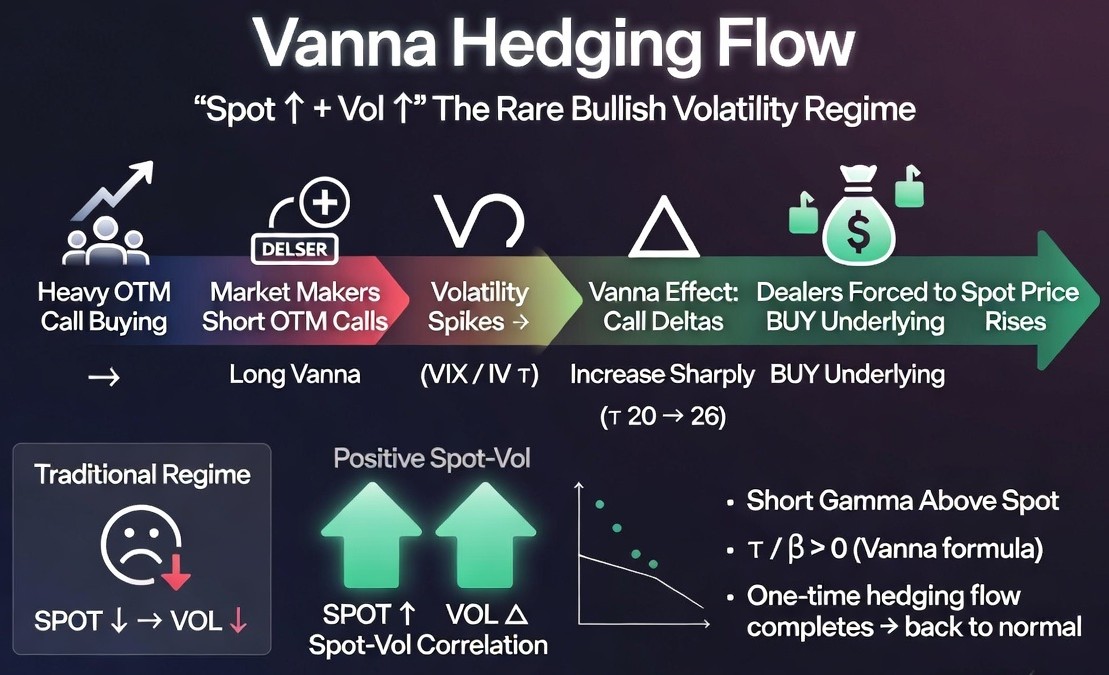
2. The Unusual “Spot Up, Vol Up” Regime 🔥
Everything flips when heavy OTM call buying floods the market (from retail, momentum funds, or hedgers).
Market makers end up net short a large chunk of OTM calls sitting above spot > putting them long vanna.
Now, when implied volatility rises:
- The delta of those short OTM calls increases sharply.
- Dealers suddenly become too long delta.
- They are forced to buy futures/cash or options pairs to re-hedge.
Outcome: VIX ↑ + Spot ↑ at the same time.
This rare positive correlation regime (positive spot-vol correlation ) is exactly what you’ve spotted in SPX or Nifty what’s grabbing attention in the US and Indian markets right now.
In US markets , Massive call buying has created an extremely unusual positive spot-vol correlation was last seen clearly in 2018.
Market makers being short gamma above spot turns volatility spikes into bullish fuel for rallies.
3. The Math Behind the Magic (Simple Version)
Vanna = how much an option’s delta changes when volatility changes.
For OTM calls (strike > spot), vanna is strongly positive. A small volatility jump (e.g., 16% → 20%) can turn a 20-delta call into a 25–26 delta call.
If dealers are short thousands of these contracts, they must instantly buy tens of thousands of shares/futures.
Once this one-time hedging is complete, the market typically snaps back to its normal inverse relationship i.e. negative spot-vol correlation
4. How to Spot This Regime Early
✅ Unusually flat skew (Put IV – Call IV drops to very low levels)
✅ OTM calls suddenly richer than normal
✅ Gamma exposure charts showing peak short gamma above current spot
✅ Positive spot-volatility moves, especially at market open
5. Practical Lessons
- Volatility spikes can actually support the rally in this regime instead of killing it.
- Rallies become more resilient and explosive.
- But once vanna flow is exhausted or positions roll → reversals can be brutal and fast.
- Edge comes from watching skew daily, tracking gamma flips, and respecting the regime shift.
Final Thoughts
- The market isn’t broken when you see Spot Up. Vol Up (positive spot-vol correlation).
- It’s simply operating under dealer vanna rules.
- Mastering this single concept separates reactive traders from those who stay one step ahead of the big flows. Whether you trade options in indices, learning to read skew + gamma positioning gives you a real, lasting edge in both normal and unusual regimes.
- Stay sharp. Watch the skew. Respect the Vanna.
- The market is always teaching :sometimes it just changes the lesson mid-semester.
Disclaimer: The content of this post is purely educational and derived from standard textbooks. It does not constitute investment or trading advice, including the buying or selling of indices, in any global financial market.