📊 The Contemporaneous Power of Dealer Gamma: Why Gamma Positioning Momentum Explains Same-Day Equity Returns Better Than Its GEX Level.
⚡The Velocity of Gamma: Measuring Short-Run Dealer Hedging Flows in the S&P 500.
Introduction
Over the past decade, measures of dealer gamma positioning have become increasingly important for understanding short-term equity market dynamics. While the influence of gamma positioning on volatility and longer-term market behavior is widely discussed, its immediate impact on same-day returns is less frequently quantified. This analysis examines the contemporaneous relationship between gamma positioning and S&P 500 returns, with a focus on the distinction between the level of dealer gamma positioning and its daily momentum.
((To clarify upfront: these are contemporaneous relationships. This means we are analyzing how dealer gamma positioning and price moves behave simultaneously, rather than whether gamma predicts future returns. While this focus on market mechanics does not directly generate alpha signals, establishing a sound methodology is a prerequisite for alpha generation-trading signals are ultimately built by stacking robust frameworks on top of each other!))
Data and Variable Construction
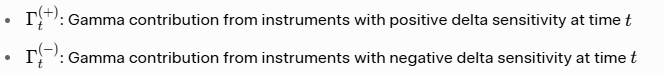
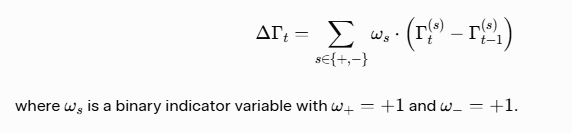
We analyze daily S&P 500 data along with a measure of aggregate gamma positioning for last 15 years ( reference (a)). To capture the directional nature of gamma contributions, we define:
From these, we construct:
- Gamma Positioning: The aggregate level of dealer gamma positioning.
- Normalized Gamma Positioning: The normalized aggregate level of dealer gamma positioning with respect to closing prices.
Gamma Positioning Momentum : The daily change in dealer gamma positioning :
Stationarity Analysis
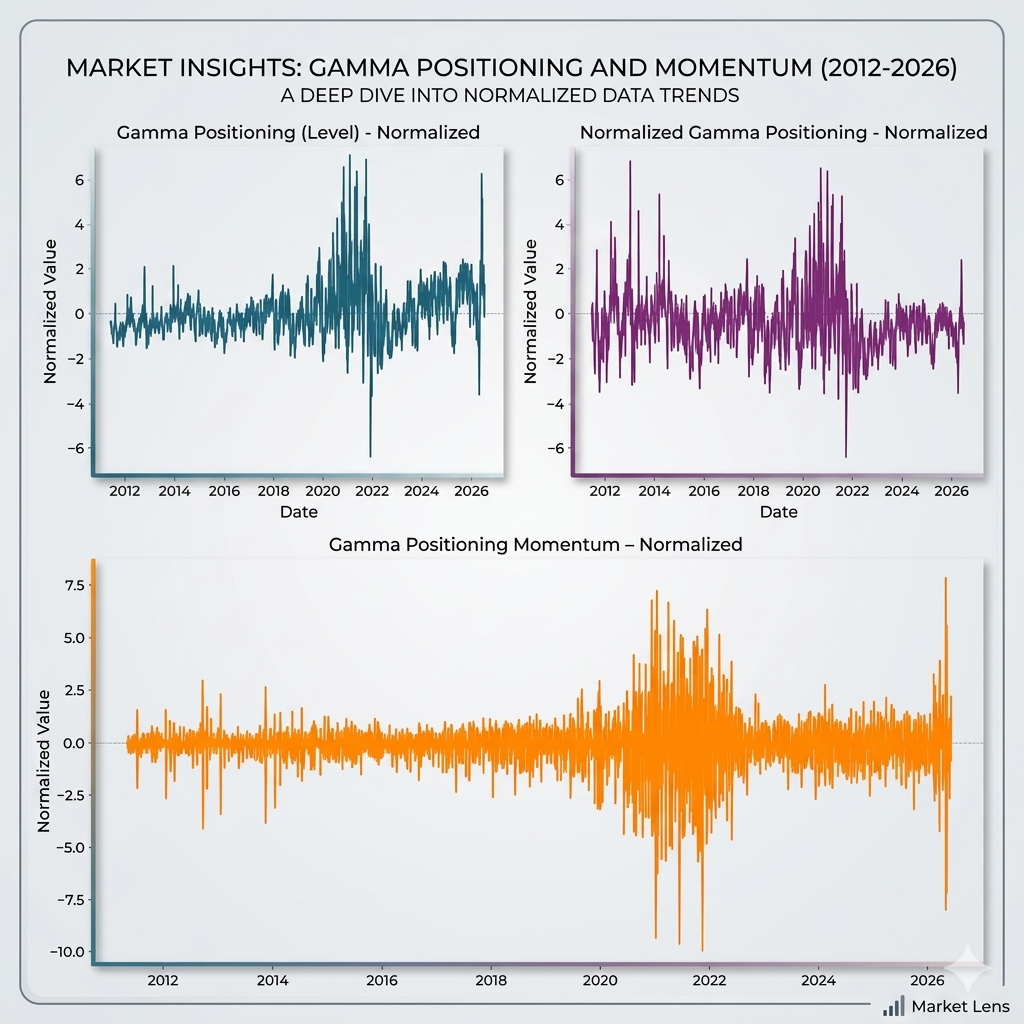
- Gamma Positioning Momentum is strongly stationary, while the level of Gamma Positioning shows signs of non-stationarity (particularly post-2020). This makes momentum more suitable for modeling short-term return relationships.
Stationarity Comparison of Gamma Positioning Variables
Contemporaneous Effects: Level vs Momentum
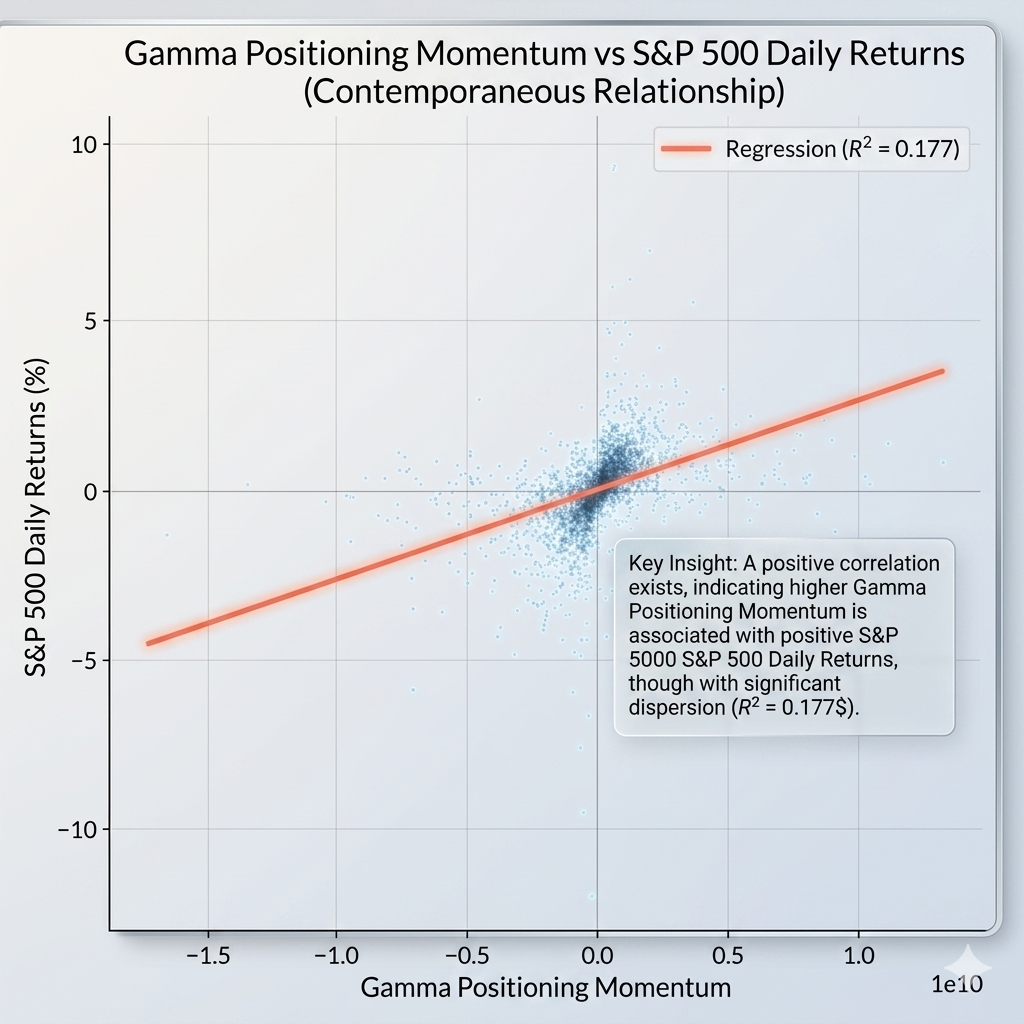
Gamma Positioning Momentum vs S&P 500 Returns
When explaining same-day S&P 500 returns, Gamma Positioning Momentum demonstrates a substantially stronger relationship than the level of gamma positioning. Gamma Positioning Momentum explains approximately 17.7% of the variation in same-day S&P 500 returns, with a highly significant positive slope.
Normalized Gamma Positioning vs S&P 500 Returns
In contrast, the level of Normalized Gamma Positioning shows only a weak contemporaneous relationship with daily returns (R² ≈ 6.6%).

A Quick Note on the “Normalized” Charts
In the charts above, “normalized” simply means we adjusted the gamma positioning numbers so they’re on a comparable scale (basically turning them into standard units with a mean of zero). This makes it easier to compare relationships without worrying about the raw size of the numbers. It doesn’t change the underlying pattern - it just makes the visuals cleaner.
Looking at It Another Way: Distribution Across Momentum Quintiles
We also split days into five groups (quintiles) based on how strong the gamma positioning momentum was that day, and looked at the distribution of returns in each group.
Distributional Analysis: Gamma Positioning Momentum Quintiles
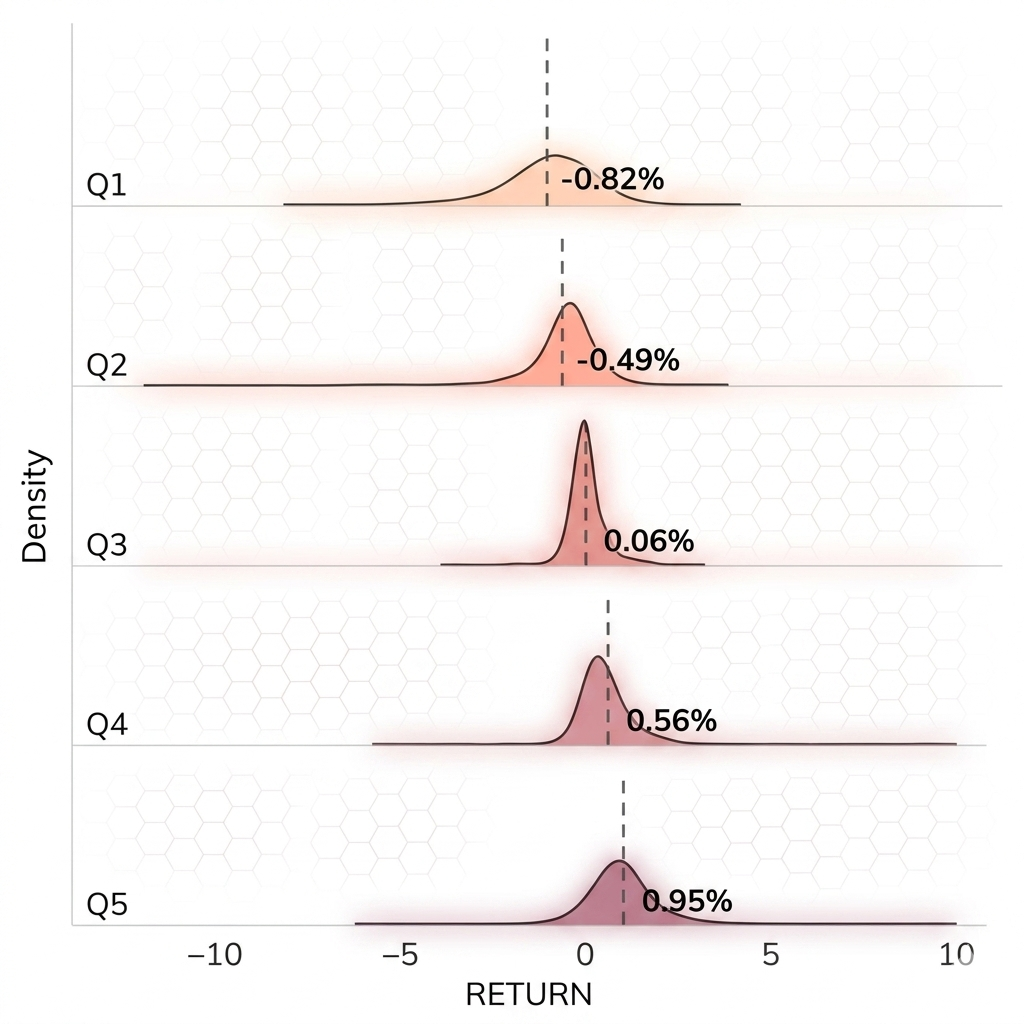
To further examine the contemporaneous relationship, we analyze the distribution of same-day S&P 500 returns across quintiles of Gamma Positioning Momentum. The ridgeline plot reveals a clear monotonic pattern: as dealer gamma positioning momentum moves from strongly negative (Q1) to strongly positive (Q5), the distribution of same-day returns shifts rightward. Large positive momentum days are associated with higher returns and greater right-skew
Distribution of Same-Day Returns by Gamma Positioning Momentum Quintiles
Violin Plot – Distribution of Returns by Gamma Positioning Momentum Quintiles
The violin plot confirms the same relationship, with explicit mean returns increasing consistently from Q1 (−0.82%) to Q5 (+0.95%). This distributional evidence strongly supports the conclusion that gamma positioning momentum has a powerful same-day impact on equity returns.
Violin Plot – Distribution of Returns by Gamma Positioning Momentum Quintiles
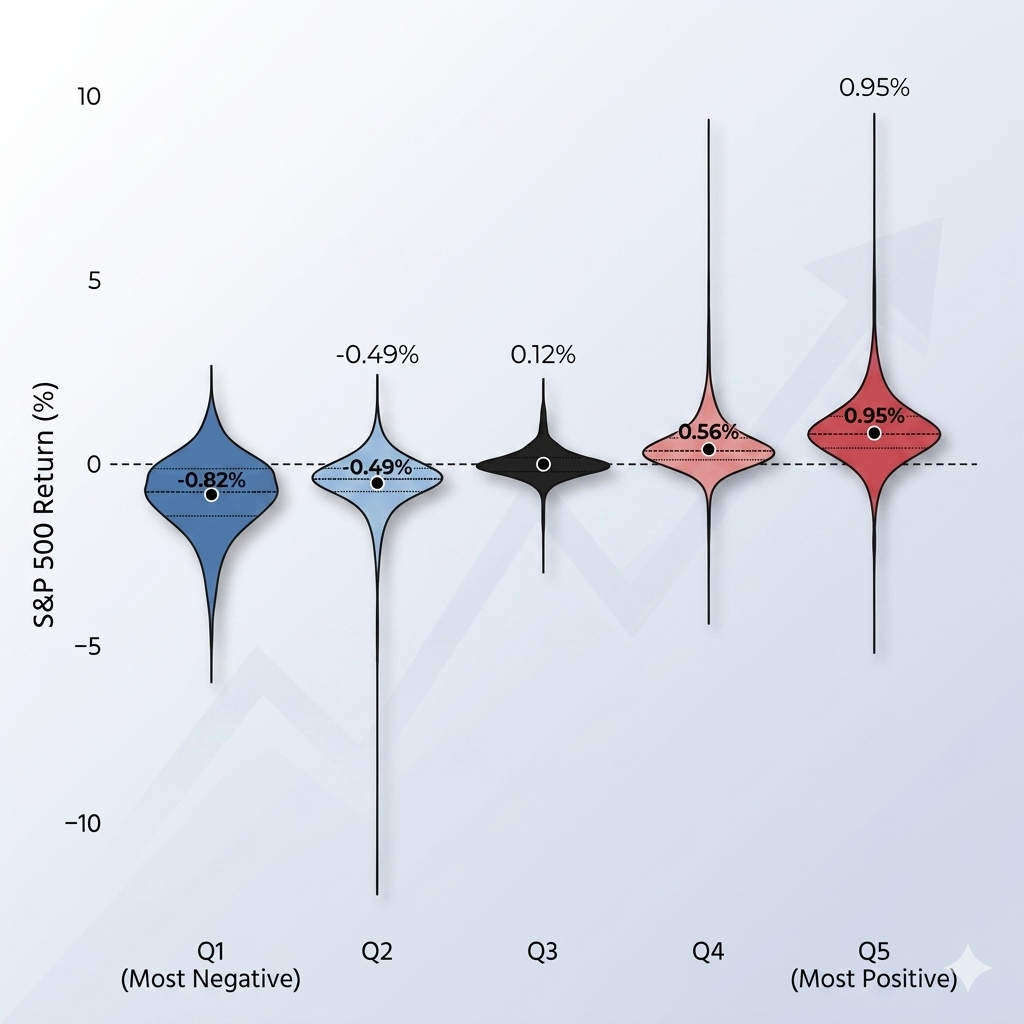
You can see the pattern clearly: days with strongly positive gamma positioning momentum (Q5) tend to have higher returns and a more favorable distribution, while strongly negative momentum days (Q1) lean the other way. The middle buckets are much more mixed.
Key Takeaway on Contemporaneous Relationships
These results clearly demonstrate that changes in gamma positioning (momentum) are a much more powerful driver of same-day equity returns than the level of gamma positioning itself.
Error Correction Model (Long-Run and Short-Run)
We also examined whether gamma positioning and the S&P 500 share a longer-run relationship using an Error Correction Model framework.
Long-Run Cointegrating Relationship
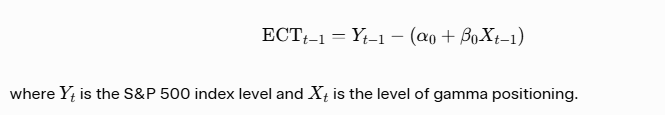
First, we estimate whether the S&P 500 index level and the level of aggregate dealer gamma positioning move together over time. The Error Correction Term (ECT) captures deviations from this long-run equilibrium:
Short-Run Dynamics
By using Gamma Positioning Momentum (the daily change in position) directly, you avoid duplicate variables and multicollinearity:

- Gamma Positioning Momentum: Reflects immediate, same-day impacts of dealer hedging, with a positive coefficient signaling its influence on market direction.
- γ is the error correction coefficient. A negative coefficient ensures stability, meaning short-term deviations revert to the long-run equilibrium.
This specification is mathematically valid and avoids the multicollinearity issue of including the same change variable twice.
In this specification, the coefficient on Gamma Positioning Momentum remains positive and significant, consistent with the contemporaneous findings above. The error correction term is negative (as expected for stability), suggesting that deviations from any long-run relationship are gradually corrected over time. However, because of regime shifts in the behavior of gamma positioning (particularly around 2020), we treat these ECM results as exploratory rather than definitive.
Why Does Dealer Gamma positioning Momentum Matter More ?
This is the fun part (and where things get a bit more speculative). The level of dealer gamma positioning tells us something about the overall “state” of dealer positioning. But what actually moves prices on any given day is the flow - how much hedging pressure is being applied right now. That’s what momentum captures.
When gamma positioning changes meaningfully from one day to the next, dealers have to adjust their hedges. Those adjustments show up as real buying or selling in the underlying market. The absolute level matters less for short-term price action than how much that level is shifting.
(One small observation from the scatter plots: the relationship also looks a bit heteroskedastic - meaning the spread of returns gets wider when momentum is more extreme. That’s intuitive too. Big gamma swings probably coincide with higher uncertainty or more aggressive positioning overall.)
Conclusion
This analysis provides strong evidence that Dealer Gamma Positioning Momentum has a powerful contemporaneous relationship with same-day S&P 500 returns, explaining approximately 17.7% of return variation. In contrast, the level of Gamma Positioning shows only a weak relationship with daily returns.
The distributional analysis across momentum quintiles further confirms that positive gamma positioning momentum is associated with higher same-day returns and greater right-skew in the return distribution. These findings are consistent with the mechanical impact of dealer delta-hedging flows, which respond to daily changes in gamma exposure.
While the level of gamma positioning exhibits a long-run cointegrating relationship with the S&P 500 index level, it is the daily momentum in gamma positioning that primarily drives short-term return behavior. This distinction has important implications for short-term modeling, signal generation, and understanding the microstructure dynamics of equity markets.
- Gamma Positioning Momentum has a clear, strong contemporaneous relationship with same-day S&P 500 returns.
- The level of gamma positioning does not or weak relationship.
(a) Acknowledgments & Data Sources
This research was made possible using the foundational Gamma Exposure (GEX) metrics developed by Squeezemetrics. We highly recommend checking out their original whitepapers for a deep dive into the mechanics of options-driven market liquidity and dealer hedging flows. Gamma Exposure (GEX): Quantifying hedge rebalancing in SPX options. Available at: https://squeezemetrics.com/monitor/download/pdf/white_paper.pdf.
Disclaimer: The content of this post is purely educational and derived from standard textbooks. It does not constitute investment or trading advice, including the buying or selling of indices, in any financial market.