ATM Straddles Price the MAD, Not “Volatility”: The Intuitive Explanation Every Options Trader Needs
Most traders know the rule of thumb that an ATM straddle is worth roughly 0.8 × σ × √T × Spot. But far fewer understand why this number appears and what it actually represents.
The answer lies in a simple statistical concept: Mean Absolute Deviation (MAD).
This single idea explains:
- Why ATM straddles behave the way they do
- How to think about “fair” pricing
- Why fat tails matter so much in real markets
The Closed-Form ATM Straddle Price
Under the Black-Scholes framework (or normal returns approximation), the price of an at-the-money forward straddle is given by:
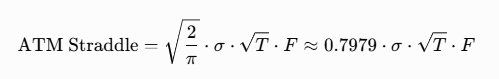
Traders round this to the familiar:
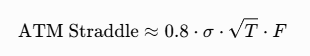
This is not just a convenient approximation- it has a beautiful interpretation.
The Gaussian Connection: SD vs MAD
Assume returns are normally distributed (the standard modeling assumption).
For a standard normal distribution:
- Standard Deviation (SD) = 1
Mean Absolute Deviation (MAD)
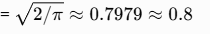
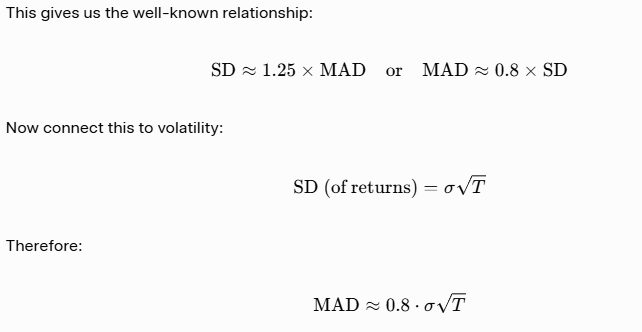
This is exactly the ATM straddle price.
Why the Straddle Prices the MAD
The ATM straddle payoff at expiry is = |S_T - K|
Under the risk-neutral (or normal) measure, the expected absolute deviation is precisely the MAD.
So when you buy or sell an ATM straddle, you are not directly trading “volatility” in the SD sense. You are trading the expected typical move size - the MAD.
This is why the 0.8 factor appears naturally. It is not arbitrary.
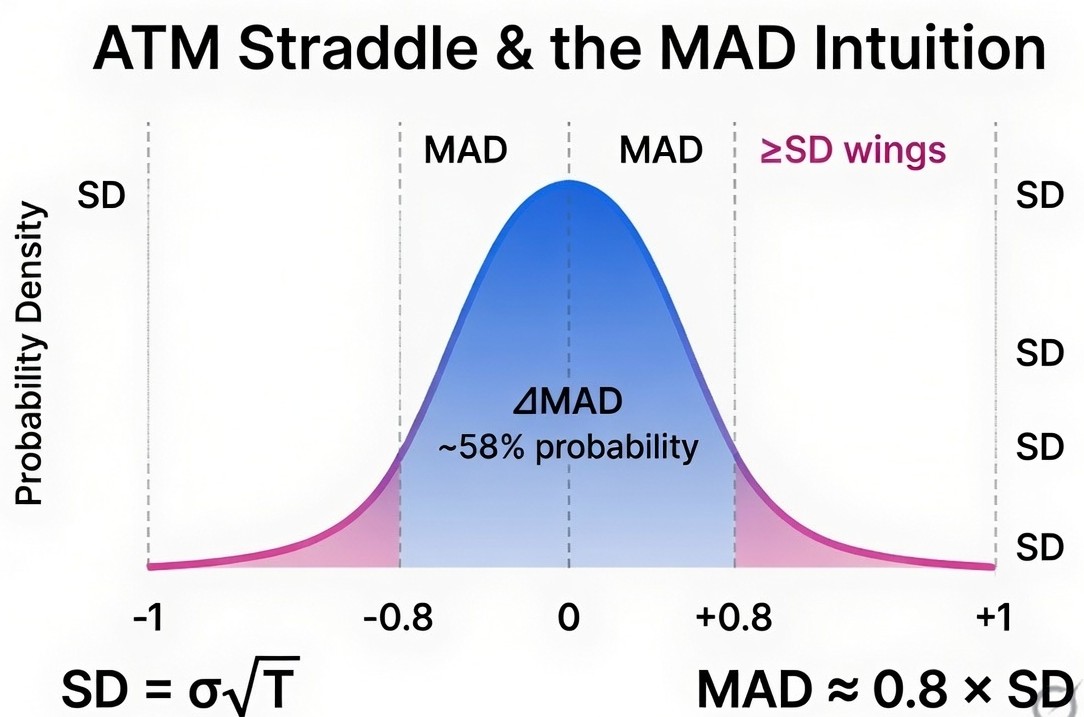
Probability Interpretation
Under a normal distribution:
- Probability that the move stays inside ±MAD (the blue region) ≈ 58%
- Probability that the move stays inside ±1 SD (blue + pink regions) ≈ 68%
This leads to one of the most useful trader intuitions:
If the straddle is fairly priced and returns are normal, the absolute move will exceed the straddle premium roughly 42% of the time.
In other words, even when realized volatility exactly matches implied volatility, a long ATM straddle held to expiry still loses money on more than half the occasions. This is normal - it is a feature of the distribution shape, not a bug.
The Quote vs. The Cash
When a broker quotes you an Implied Volatility (σ) for a straddle, they are giving you an abstract statistical measure. However, what you actually pay in cash is the premium.
That premium is not directly the standard deviation. Instead, it represents the expected absolute move of the underlying- mathematically equal to the Mean Absolute Deviation (MAD) of the distribution.
In other words:
The straddle does not price volatility (σ) directly in cash terms. It prices the expected typical move size, which under a normal distribution equals approximately 0.8 × σ√T × Spot.
This is why we use the “0.8 translator.” We multiply the standard deviation by ~0.8 because that is the mathematical relationship between SD and MAD in a Gaussian world.
Core Takeaway:
A straddle does represent volatility, but only indirectly. It measures the size of the typical move (MAD), not the variance or the extremes. It converts the abstract concept of standard deviation (σ) into the actual cash amount you will likely see move in the underlying.
This distinction becomes especially important when real markets deviate from normality - i.e., when fat tails are present and the SD/MAD ratio rises above 1.25.
The Fat Tail Diagnostic Most Traders Ignore
Here is where this framework becomes powerful in real markets.
In a perfect normal world, the ratio is fixed:
SD/MAD=1.25
But real asset returns (in equity/equity indices etc.) exhibit fat tails. Large moves contribute disproportionately to variance (because deviations are squared) compared to MAD (which treats them linearly).
Result: When fat tails are present,
SD/MAD > 1.25
This tells you that the straddle (which prices the MAD) may be understating tail risk. This is one of the cleanest ways to see why:
- Selling naked straddles/strangles can be dangerous
- OTM options often trade at higher implied volatility (the volatility smile/skew)
- Gamma scalping or tail-hedging strategies can have positive expectancy even when “vol is realized”
Practical Takeaways for Options Traders
- Use MAD thinking when evaluating straddle trades Instead of only asking “Is implied vol cheap or expensive vs historical SD?”, also ask: “Is the straddle price cheap or expensive relative to recent typical move size (realized MAD) ?”
- Monitor the SD/MAD ratio A rising ratio is often an early warning of increasing tail risk or regime change.
- The 42% rule is your friend It keeps expectations realistic. Even “good” straddle-selling setups lose on more than half the days when held to expiry.
- Combine with other edges This is why many sophisticated gamma and volatility traders focus on DTE-specific rules, trend filters, skew, and realized vs implied MAD rather than simple “short premium” approaches.
Final Thought
The 0.8σ√T rule is not just a shortcut. It is a direct consequence of the fact that ATM straddles price the mean absolute deviation, not the standard deviation.
Understanding this distinction gives you a clearer mental model for:
- Why straddles behave the way they do
- How fat tails distort risk
- Where the real edge in volatility trading often lies
Next time you look at an ATM straddle price on equity or equity indices, ask yourself: “Is this pricing a reasonable MAD for the expected move, or is the market under- or over-weighting the tails ?”
That single question will improve your options intuition more than most complex models.
Disclaimer: The content of this post is purely educational and derived from standard textbooks. It does not constitute investment or trading advice, including the buying or selling of indices, in any financial market.